

Email marketing remains one of the most powerful and direct channels to connect with potential and existing customers. Whether you’re sharing a new blog post, distributing a newsletter, or promoting products, emails enable personalized communication that builds strong audience connections. With advanced automation tools, launching effective email campaigns is easier than ever.
Still wondering if email marketing is a worthwhile investment? The latest statistics overwhelmingly confirm its continued value and high impact.
Top Email Marketing Statistics at a Glance
- Email marketing boasts an impressive average ROI of $36 for every $1 spent.
- 79% of marketers rank email among their top 3 most effective marketing channels, alongside paid search, organic search, social media, and events.
- 44% of online shoppers report that emails significantly influenced their buying decisions, outperforming ads in content (32%), social media ads (21%), organic social (18%), search engine ads (17%), text messages (12%), and influencer marketing (7%).
- 347.3 billion emails were sent worldwide last year.
- There are 4.4 billion email users globally. Over half the world’s population uses email, and this figure is projected to exceed 4.8 billion by 2027.
General Email Marketing Statistics
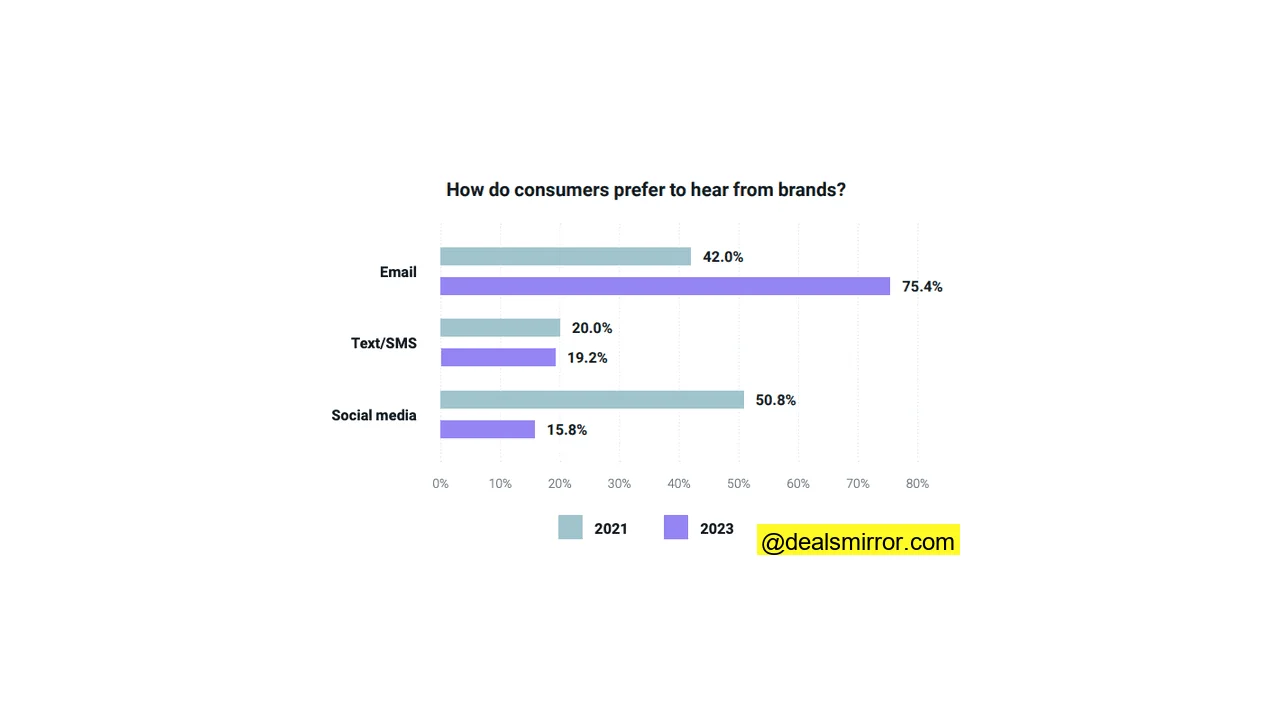
- 75.4% of consumers prefer receiving communications from brands via email. This significantly outweighs preferences for SMS (19.2%) and social media messages (15.8%).
- The daily volume of business and consumer emails sent and received is projected to reach 408.2 billion by the end of 2027.
- 91% of businesses leverage email for client communication, with 61% identifying it as their preferred method for both client and colleague interactions.
- Email marketing delivers an average ROI of $36 for every $1 invested.
- 34% of email marketers occasionally use generative AI for copy creation. This makes AI for copy more prevalent than video (33%) and CSS-based interactivity (26%) in email campaigns.
- A majority of marketers (82%) use automation for triggered emails. Other common uses include automated emails (79%), drip or nurture campaigns (67%), segmented campaigns (56%), A/B testing (45%), reporting (32%), content creation (27%), list verification (25%), contact management (19%), email development (12%), and QA testing (7%).
- 41% of marketers consider email marketing very critical to their company’s overall success, while 90% view it as at least somewhat critical.
- 62% of companies increased their email marketing budget. Email stands as the top channel for US B2B and B2C marketers, ahead of social media (52%) and influencer marketing (50%).
- 16.4% of marketers describe their email campaigns as very successful. Another 43.5% consider them somewhat successful, 29.4% average, 8.4% somewhat unsuccessful, and 2.3% very unsuccessful.
- 42.7% of marketers prioritize open rate as the most important success metric. This is closely followed by click-through rate (42.1%), conversion rate (26%), revenue from email (21.8%), delivery rate (21.6%), click-to-open rate (21.3%), unsubscribe rate (17.1%), list growth (14%), inbox placement rate (13.5%), spam complaints (9.9%), email ROI (7.4%), read/skim/delete (6.2%), customer retention (4.2%), and product adoption (3.8%).
- 34.4% of marketers cite design and copy as the primary contributors to campaign success. Other key factors include improving deliverability (34.4%), cohesive strategy (32.1%), ability to measure performance (27.7%), segmentation and personalization (27.6%), increasing engagement (26.5%), integrating data from other sources (23.1%), list building (15.5%), quality assurance (9.8%), and A/B testing (5.3%).
- 49.5% of marketers report that email’s most important objective is content distribution. Other objectives include transactional communication (35.3%), promotions and selling (30.5%), product or company updates (26.8%), lead nurturing (25.7%), customer retention (21.3%), onboarding (17.3%), website traffic (14.1%), communication with support (10.3%), and reactivation (7%).
- 37.3% of marketers identify standing out in the inbox as their biggest campaign constraint. Additional constraints include inbox placement issues (32.7%), lack of time or focus (32.7%), declining email use (27.3%), lack of support or investment (26.7%), data privacy compliance (22.5%), email security (18.2%), inability to measure performance (13.4%), and inadequate marketing technology (11.7%).
- 36.1% of marketers consider creating responsive emails their biggest design and development challenge. Other challenges include inconsistent rendering (35.1%), dark mode (24.5%), email coding problems (22.8%), accessibility issues (22.4%), following style guidelines (22%), insufficient tools (19.5%), finding or building templates (17.6%), adding interactivity (16.1%), and email team collaboration (8.8%).
- 29% of marketers clean their email lists monthly or more frequently. Others clean quarterly (27%), once or twice a year (16%), or rarely (16.8%). 11.2% never clean their lists.
- Marketers also manage list hygiene by removing blocks and spam complaints (36%), validating emails at signup (29.3%), sending re-engagement campaigns (28.3%), using a suppression list (28%), or performing bulk email address verification (25.4%).
- 42.8% of organizations have email teams of 2 to 5 people. 33.4% have only one person, 13.8% have 6 to 10 people, and 10% have 11 or more.
- 47.2% of marketers complete their email production process in less than a week. This includes writing, design, development, and optimization. Others take 1 to 2 weeks (35.1%), 2 to 3 weeks (12.8%), or a month or more (4.9%).
- 69.9% of one-person email marketing teams report completing the email production process in under a week. In contrast, only 29.2% of teams with over 10 members achieve this timeframe.
- 36.2% of marketers consistently use a defined email design system for new campaigns. 38.2% do so sometimes, and 19.9% never. (An email design system consists of defined standards, modules, and reusable components aligned with brand style guidelines.)
- 41.3% of marketers plan to integrate personalization into their email marketing strategy. Other planned additions include segmentation (34.9%), send time optimization (31%), email authentication (30.7%), preference centers (26.9%), interactive content (26.5%), accessible design (20.6%), user-generated content (19.2%), animation or video (17%), and AI-powered tools (13.7%).
- 41.8% of marketers identify email marketing as the channel offering the best ROI during an economic downturn.
B2B Email Marketing Statistics
- 49% of B2B marketers use generative AI to create emails.
- In 2021, 70% of brands increased their email marketing workload without increasing their budgets. Email volume and last-minute email changes rose by 61% and 45%, respectively.
- 55% of email marketers rarely or never use A/B testing.
- 43% of email marketers adjusted their methods for measuring email performance due to Apple’s Mail Privacy Protection (MPP). 24% made no changes, and 23% were uncertain.
- 77% of B2B buyers prefer to be contacted via email, more than double any other channel.
- 69% of B2B marketers utilize email newsletters for content distribution.
- The percentage of B2B marketers using email marketing software decreased to 68% in 2022, down from 75% in 2021.
- 83% of B2B marketers track email engagement as a metric for content performance.
- 59% of B2B marketers use email subscribers as a metric to track content performance.
- 59% of B2B companies do not currently use email marketing.
- 8% of B2B email marketing campaigns fail to include an unsubscribe link.
- B2B companies send out an average of 1 email marketing campaign every 25 days.
B2C Email Marketing Statistics
- 55% of consumers prefer that small businesses contact them via email.
- 57% of small business owners (100 employees or less) plan to increase their email marketing spending, while 10% plan to reduce it, and 33% will maintain current spending.
- 64.1% of small businesses report email as their most frequently used marketing channel.
- 71.8% of small businesses communicate with their customers using email.
- 79% of marketers include email in their top 3 most effective marketing channels.
- 81% of email marketers send newsletters to customers. Other common email types include welcome emails (79%), product emails (75%), sales or promotions (72%), event emails (71%), onboarding or post-purchase emails (62%), and customer win-back emails (45%).
- Automated emails boast an average open rate of 40.55%, significantly higher than the average campaign open rate of 26.64%. Automated emails also outperform campaigns across all other metrics, with a click-to-open rate of 12.99% compared to 4.65% for campaigns.
- The click-to-conversion rate for automated emails is 33.48%, whereas for campaigns it’s only 5.88%. This means approximately 1 in 3 people who click on an automated email make a purchase.
- 61% of email marketers lack a clear view of their email marketing ROI.
- 44% of online shoppers state that general emails influenced their buying decisions. Other influential email types include order confirmation and shipping notification (23%), cart abandonment (20%), and back-in-stock emails (20%).
- 23% of online shoppers were influenced by offers within confirmation or shipping notification emails.
- 20% of online shoppers were influenced by offers in cart abandonment emails.
- 20% of online shoppers were influenced by offers in back-in-stock emails.
- 72% of online shoppers open email advertising a few times per week, with 43% doing so at least once a day.
Industry Vertical Email Marketing Statistics
- The top 3 industry verticals for campaign open rates are auto (32.5%), fashion and apparel (32.1%), and firearms and weapons (31.9%). Industries with the lowest open rates include holidays and seasonal (22.2%), antiques and collectibles (21.6%), and smoking and vaping (16.6%).
- Firearms and weapons (3.69%), gifts (1.83%), and games (1.72%) have the highest campaign click rates. Conversely, fashion and apparel (0.98%), beauty and cosmetics (0.83%), and smoking and vaping (0.75%) have the lowest.
- The industry verticals with the highest click-to-conversions in email campaigns are smoking and vaping (21.95%), games (17.61%), and auto (16.14%). Gifts (2.55%), holiday and seasonal (1.83%), and adult (1.73%) verticals rank lowest.
- In e-commerce, home and garden (41.13%), sporting goods (40.76%), and food and beverage (40.58%) boast the highest email campaign open rates. Health and beauty (37.82%), office supplies (37.79%), and mass merchants (31.1%) have the lowest.
- Toys and hobbies (1.81%), automotive (1.73%), and hardware and home (1.67%) are the industries with the highest average click rates. Specialty (1.38%), mass merchant (1.19%), and health and beauty (1.05%) experience the lowest.
- Food and beverage (0.18%), health and beauty (0.12%), and toys and hobbies (0.10%) show the highest order placement rates by industry. Electronics (0.05%), mass merchant (0.05%), and jewelry (0.05%) have the lowest placed order rates.
- Sporting goods (54.1%), home and garden (53.3%), and food and beverage (53.2%) lead in email workflow open rates. Health and beauty (50.03%), office supplies (50%), and mass merchant (46.4%) exhibit the lowest.
- The industries with the highest email workflow click rates are sporting goods (6.22%), automotive (5.90%), and electronics (5.78%). Office supplies (4.98%), mass merchant (4.64%), and health and beauty (4.62%) have the lowest.
- Food and beverage (1.99%), toys and hobbies (1.81%), and sporting goods (1.77%) have the highest email workflow placed order rates by industry. Electronics (1.49%), jewelry (1.48%), and mass merchant (1.31%) have the lowest.
- Sporting goods (57.63%), food and beverage (55.52%), and automotive (55.1%) have the highest welcome workflow open rates by industry. Specialty (53.64%), health and beauty (51.64%), and mass merchant (48.79%) have the lowest.
- The industries with the highest welcome workflow click rates are sporting goods (6.95%), automotive (6.67%), and toys and hobbies (6.60%). Jewelry (5.56%), health and beauty (5.24%), and mass merchant (5.10%) experience the lowest.
- Toys and hobbies (2.50%), clothing (2.46%), and food and beverage (2.46%) boast the highest welcome workflow order placement rates by industry. Jewelry (1.85%), electronics (1.82%), and mass merchant (1.79%) have the lowest.
- Food and beverage (52.16%), home and garden (51.74%), and sporting goods (51.69%) lead in abandoned cart workflow open rates. Office supplies (49.08%), electronics (48.92%), and mass merchants (46.25%) have the lowest.
- The industries with the highest abandoned cart workflow click rates are hardware and home (6.96%), sporting goods (6.95%), and home and garden (6.74%). Specialty (5.98%), health and beauty (5.68%), and mass merchant (5.41%) have the lowest.
- Automotive ($0.16), food and beverage ($0.16), and hardware and home ($0.14) are the industries with the highest email revenue per recipient. Office supplies ($0.09), toys and hobbies ($0.09), and jewelry ($0.08) have the lowest revenue.
- The industries with the highest email workflow revenue per recipient are automotive ($5.47), hardware and home ($4.51), and sporting goods ($3.42). Food and beverage ($1.60), office supplies ($1.54), and health and beauty ($1.32) have the lowest.
- Automotive ($6.29), hardware and home ($5.70), and sporting goods ($4.47) generate the highest revenue per recipient on welcome workflows. Office supplies ($2.05), food and beverage ($1.89), and health and beauty ($1.85) have the lowest revenues.
- The industries with the most revenue generated per recipient from abandoned cart workflows are automotive ($9.86), hardware and home ($9.63), and sporting goods ($6.73). Food and beverage ($2.92), office supplies ($2.89), and health and beauty ($2.65) have the lowest.
- In email campaigns, the hardware and home industry has the highest unsubscribe rate at 0.51%, followed by home and garden at 0.42%, and food and beverage at 0.41%. Industries with the lowest unsubscribe rates are mass merchant (0.32%), jewelry (0.28%), and clothing (0.27%).
- The industries with the highest email workflow unsubscribe rates are hardware and home (1%), home and garden (0.97%), and office supplies (0.95%). Health and beauty (0.67%), jewelry (0.66%), and clothing (0.64%) have the lowest.
- Communications (48.8%), nonprofits (39.7%), and publishing (37.5%) are the industries with the highest open rates. Health and beauty (27.7%), financial services (26.5%), and internet marketing (21.9%) are at the lower end.
- Communications (5.8%), publishing (5.4%), and financial services (4.4%) are the industries with the highest average click rates. Retail (2%), health and beauty (1.8%), health care (1.7%), and internet marketing (1.7%) have the lowest click rates.
- 9.19% of email marketing campaigns across different industries utilized double opt-in, while 90.81% used single opt-in, according to GetResponse’s 2022 analysis.
- Marketers in the publishing industry use double opt-in the most at 26.64%, with the retail industry using it the least at 3.06%.
- Marketers in the retail industry used single opt-in the most at 96.94%, while the publishing industry used it the least at 73.36%.
- The wellness and fitness industry has the highest unsubscribe rate at 0.4%. Consumer packaged goods; media, entertainment, and publishing; restaurant, food, and beverage; and retail industries have the lowest at 0.1%.
- The Asian-Pacific region records the highest bounce rate at 0.58%. EMEA (Europe, the Middle East, and Africa) has the lowest, while North America is at 0.57% and Latin America at 0.63%, based on Brevo’s 2022 campaign data.
Email Personalization and Segmentation Statistics
- Over 80% of email marketers reported performance improvements from using subject line personalization, live or real-time content, and personalization via dynamic content.
- More than 90% of email marketers confirmed that email segmentation increased performance.
- 90% of email marketers believe personalization is crucial to their overall business strategy.
- 55% of email marketers prioritize personalization in their email programs.
- 80% of customers are more likely to make a purchase from brands offering personalized experiences.
- 83% of customers are willing to share their data to facilitate a personalized experience.
- 76% of customers desire more personalized attention from marketers to foster an intimate brand relationship.
- 80% of marketers use a lead’s name, company, and other profile data for email personalization.
- 64% utilize segments (e.g., prospects vs. customers) to personalize their emails.
- Other personalization data points include geolocation (40%); past purchases or donations (34%); previous interactions with products or services (33%); past website interactions (26%); member, reward status, or points (23%); and gender, race, or other demographics (14%).
- 65% of marketers create at least 2 versions of an email on average to target content effectively to different audiences.
- 16% of marketers create 4 or more versions of the same email on average.
- 59% of marketers now prioritize expanding marketing automation to support personalized email delivery.
- 46.5% of marketers use email personalization to add names to email copy. Other uses include names in subject lines (36.5%), transactional emails (33.7%), product recommendations (27.5%), content recommendations (27.4%), imagery or graphics (20.6%), user statistics (16.2%), and milestone emails (10.9%). 14.8% reported not using personalization.
- 47.6% of marketers using personalization rate their email campaigns as very successful.
- Personalized emails achieve higher open rates and lower bounce rates. Personalized emails have a 30.3% open rate compared to 26.6% for non-personalized emails, and a bounce rate of 2.4% versus 3.6%.
- Most marketers segment their lists based on purchase history (46.7%), engagement level (40.7%), and geographic location (25.9%).
Email Deliverability Stats
- 36% of marketers cite managing bounce rates and spam complaints as their biggest email list hygiene challenge. Identifying and removing inactive subscribers (31.2%) and integrating multiple data sources for a unified list (29.6%) are also top concerns.
- 39.5% of email marketers maintain clean lists by occasionally removing inactive subscribers. 36.8% use double opt-in, and 33.2% rely on an email verification service.
- 29.2% of email marketers reported declining email deliverability rates in the last 6 months. Only 14.6% saw improvements, and 45.6% observed no significant changes.
- 42.7% of marketers do not use any email authentication. 36.8% use DKIM, 35.6% have DMARC set up, and only 22.9% use SPF.
- 41.5% of email marketers monitor their sender reputation monthly. 36% check a few times a year, 11.9% after each campaign, and 10.7% do not monitor it.
- 34.4% of marketers monitor email bounce rates with third-party tools. 32.4% get bounce rates from email provider reports, 24.1% use both, and 8.4% do not monitor them.
- 12.6% of email marketers have a bounce rate exceeding 10%. Most marketers fall into the 1% to 5% range (38.7%) or 5% to 10% range (33.6%).
- 31.6% of companies clean their email list monthly. 24.5% clean quarterly, 21.7% weekly, 10.7% annually, and 7.9% before each campaign.
- 37.7% of email marketers have experienced issues with emails not being delivered to inboxes, while 52.8% have not.
- 19.1% of companies have had their email server or domain blacklisted, with 62.2% not experiencing this issue.
- The average global inbox placement rate stands at 84.8%. This varies significantly by region, with Germany achieving 97.8% and India only 69.8%.
- The average deliverability rate was 86% across Microsoft, AOL, Gmail, and Yahoo, but only 66% for emails sent to Apple Mail.
- Businesses in the US face significant losses daily ($164+ million), weekly ($1.1+ billion), monthly ($4.9+ billion), and yearly ($59.5+ billion) due to undelivered emails.
Email Open and Click Stats
- Emails sent between 4 AM and 6 AM consistently yield the highest open rates, according to GetResponse data from 2022.
- Information Missing: This statistic was not provided in the original source.
- The average email open rate in 2022 was 26.80%, with an average click-through rate of 1.89%.
- The average click-to-open rate across all continents was 7.01%, based on a GetResponse study of over 30 billion emails in 2022.
- Oceania boasts the best average email open rate at 37.93%, while Africa has the lowest at 19.12%. Other averages include North America (31.02%), Europe (30.69%), Asia (19.14%), and South America (22.87%).
- North America leads with the largest average click-through rate at 2.96%, and Africa has the lowest at 1.16%. Other averages are Europe (2.34%), Oceania (2.15%), Asia (1.46%), and South America (1.25%).
- Email subject lines with 71 or more characters resulted in a 23.3% open rate, closely followed by those with 11 to 20 characters at 23.2% open rate, based on Gartner’s study.
- 20.2% of companies have an average open rate exceeding 30%. For most companies, it falls between 10% to 20% (36.8%) or 20% to 30% (33.2%). Notably, 5.1% do not even measure it.
- 38.3% of companies have click-through rates between 10-20%. 24.1% have a click rate lower than 10%, 23.7% are between 20-30%, and only 7.9% of marketers report over 30%.
Mobile Email Marketing Statistics
- In the United States, 75% of all emails are opened on smartphones.
- 81% of smartphone users aged 18 to 34 access emails on their mobile devices, compared to 73% of those aged 35 and up.
- Nearly 1 in 5 B2B email campaigns are not optimized for mobile devices.
Email Usage Statistics
- Globally, email remains a dominant communication channel, with billions of users relying on it daily for personal and professional interactions.
- Apple holds the largest market share among email clients at 58.07%, based on Litmus’ December 2023 analysis of 2.1 billion email opens.
- Gmail is the second-largest email client with a 29.67% market share, followed by Outlook (3.43%), Yahoo! Mail (2.55%), and Google Android (1.70%).
- 59% of Americans find stress in emails that are not useful. Other stressors include too many emails (54%), inability to unsubscribe (27%), unmanageable inboxes (24%), and unrecognized senders (19%).
- 17% of Americans have abandoned email accounts due to excessive junk mail.
- 16% of Americans find email too distracting.
- 37% of Americans identify emails from marketers and salespeople as their biggest source of stress, with 28% feeling the same about shopping emails like coupons and discount offers.
- 57% of Americans utilize personal email accounts.
The 5 Benefits of Email Marketing
Businesses have compelling reasons to integrate email campaigns into their marketing strategies. In many aspects, email marketing consistently outperforms other tactics, as evidenced by the statistics above.
Here are key reasons why email marketing is a vital strategy:
Measure Results
Unlike social media marketing, where managers often rely on vanity metrics, email campaigns offer clear, measurable results. You can easily track email marketing revenue and key performance indicators using robust analytics.
Target Specific Audiences
Segmented email campaigns allow for highly efficient audience targeting. This precision makes email an incredibly effective marketing channel, ensuring your transactional and promotional messages reach the right customers.
Send Personalized Emails
Personalization is a major driver of email marketing effectiveness. By using segmented campaigns, you can create personalized subject lines and content that include recipient names or other relevant details, significantly boosting click-through rates.
Get Customer Engagement
Email is a preferred channel for customer communication with brands, ensuring your marketing efforts lead to genuine engagement. Crafting friendly and relevant subject lines makes it easy to encourage customers to interact and respond.
Automate Business Communication
Investing in email automation provides a strong return on investment. Automation tools handle tasks like sending welcome emails, allowing marketing teams to focus on other strategic activities.