
Building a website is easy. You can create them with drag-and-drop page builders and easy-to-use CMS platforms. And you don’t need to know how to code.
Building a fast site that gets conversions is a different story. Even if your website builder does the heavy lifting, you still need to do speed and conversion optimization.
In this article, we’ve collected the latest website statistics you must know for a fast and high-converting website.
Top Website Statistics Highlights
- 252,000 new websites are created every week, contributing to a total website count of 1.09 billion.
- 88.5% of people leave a website if it doesn’t load fast enough.
- 61.19% of site traffic originates from mobile devices, with 38.81% from desktops.
- A page loading in 1 second achieves an average conversion rate of almost 40%.
- Common website design mistakes include crowded web design (84.6%), the absence of a call-to-action (38.5%), and hidden navigation (30.8%).
General Website Statistics
- There are over 1.09 billion websites across 271.8 million domains, supported by 12.6 million web-facing computers.
- A staggering 252,000 new websites are launched daily, breaking down to 10,500 every hour, 175 every minute, and 3 new websites every second.
- Nearly 28.8% of business operations are conducted online, reflecting a steady increase from 25.8% previously.
- For small businesses, 24% create a website to showcase products and services. Additionally, 17% build sites for direct customer purchases, and another 17% use them to establish credibility and authority.
- WordPress dominates the CMS market share at 63.3%, followed by Shopify with 6.4%, and Wix in third place with 3.9%.
- Website builders offer the most affordable site creation option, costing $0 to $50 monthly. WordPress has an upfront cost of $35-$780 and ongoing monthly costs of $11-$50. For a more convenient, albeit pricier, option, hiring a web designer can range from $500 to $10,000+.
- Wix leads the simple website builder market with a 10.5% share, ahead of Squarespace (5.48%) and GoDaddy Website Builder (2.45%).
- Amazon holds the largest market share among web hosting providers at 5.6%, with Shopify (4.4%), Newfold Digital Group (3.6%), OVH (3.2%), and Hostinger (2.8%) completing the top five.
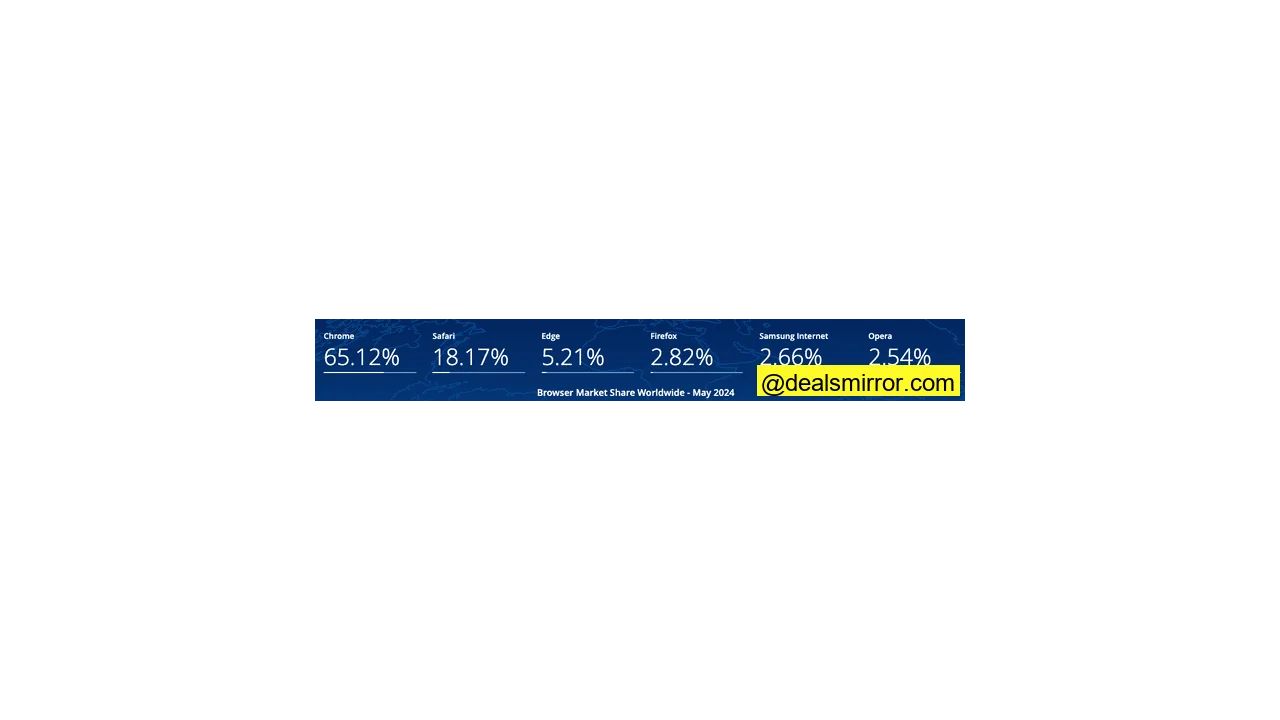
- Google Chrome commands the highest browser market share worldwide at 65.1%, followed by Safari (18.2%) and Microsoft Edge (5.2%).
Website Traffic Statistics
- Direct traffic is the leading channel, accounting for 58% of all website traffic, with organic search following at 29%, referrals at 8%, and organic social at 2%.
- 21% of small businesses identify low website traffic as their primary challenge. Other significant hurdles include a lack of time and knowledge for website maintenance (14%) and changes in search engine rankings (12%).
- Google.com holds a dominant 91.61% share of the worldwide search engine market, with Bing (3.32%) and Yandex (1.83%) trailing behind.
- 90% of enterprise companies are prioritizing organic search due to its continuous growth, with 73% of clicks this year directed to organic web results.
- The first page of Google Search results featuring the “People also ask” SERP has an impressive average CTR of 87.9%. The second and third positions receive 15.28% and 8.55%, respectively.
- Search advertising campaigns show an average click-through rate of 6.11%, a cost per click of $4.22, a conversion rate of 7.04%, and a cost per lead of $53.52.
- Google.com was the most popular website globally between September and November, 2023, attracting approximately 9 billion unique monthly visitors. YouTube.com and Facebook.com ranked second and third, with an estimated 5.66 billion and 3.02 billion unique monthly visitors.
- YouTube.com is the most engaging website worldwide, with users spending an average of 35 minutes and 42 seconds per visit. Facebook.com follows with an average visit duration of 22 minutes and 25 seconds.
Website User Experience Statistics
- A slow-loading website is the primary reason visitors leave a site (88.5%). Other factors include non-responsive design (73.1%), bad navigation (61.5%), outdated design (38.5%), poor content structure (34.6%), and intrusive use of audio/video (3.8%).
- 28% of visitors are willing to wait for a mobile site to load, while 26% will wait if the site takes longer than 5 seconds.
- For B2B businesses, 82% of pages loaded within 5 seconds. For B2C businesses, this figure rises to 86%.
- A page that loads in 1 second boasts an average conversion rate of nearly 40%. This rate significantly drops to 34% for a 2-second load time and 29% for a 3-second load time.
- The average e-commerce conversion rate is 3.05% when a page loads within 2 seconds. This drops to 0.67% for a 4-second load time, and further by 0.3% for every additional second.
- Among design tools, Illustrator (76.9%), Sketch (75%), and InDesign (32.1%) are widely used by professionals.
- 43% of small businesses plan to enhance their site’s page speed and performance. Additionally, 30% intend to embed videos, aligning with search engine algorithm updates that prioritize video content.
Mobile Website Statistics
- Mobile devices account for 61.19% of all website traffic globally, compared to 38.81% from desktops.
- 92.3% of individuals use a mobile phone or smartphone to access the internet. In contrast, 65.6% use laptops or desktops, 31.9% use internet-connected televisions, and 27.3% use tablets.
- Africa leads with the highest share of mobile internet traffic at 69.13%, surpassing the global average by 12.24%. Asia ranks second at 65.2%, while Oceania has the lowest share at 39.51%.
- Russia records the lowest mobile internet traffic at 30.2%, with Portugal (34.12%) and Canada (37.71%) also among the lowest.
- 68% of mobile users engage in video games, 67% listen to music, 63% use social media, 61% watch videos/TV/films, and 47% make online payments.
- Smartphones drive 78% of global retail site traffic and facilitate 66% of online shopping orders.
- Mobile commerce thrives in Asia, particularly in countries like China and South Korea, where mobile devices generate over two-thirds of total online sales.
- Mobile devices attract 313% more visitors and 233% more unique visitors than desktops. However, mobile bounce rates are also higher at 59.74% compared to 49.8% on desktops.
Web Design Statistics
- 35.1% of web design companies quote clients between $1,000 and $1,500 for a website design. 24.3% quote $2,000-$2,500, and 16.21% charge $3,000.
- The inclusion of features and functionalities is the top factor influencing web design costs (61.5%). UI/UX design quality and responsiveness to multiple devices are tied for second (46.1%), while the CMS type and site usability/navigation are tied for third (34.6%).
- 80.7% of web designers complete a website design within one month. 27% take two months, and 24.3% require one and a half months.
- Current web design trends include flat design (88.5%), expressive typography (61.5%), broken grid layouts (38.5%), virtual reality video (26.9%), and voice user interface and search (23.1%).
- Common website design mistakes, even among professionals, are crowded web design (84.6%), no call-to-action (38.5%), hidden navigation (30.8%), bad web typography (26.9%), and poor use of whitespace (19.2%).
- The leading reasons for website redesigns are low conversion rates (80.8%), high bounce rates (65.4%), and the desire for a better user experience (61.5%).
- Companies prefer hiring professional web designers for a completely customized website (53.8%), professional design (23.1%), conversion optimization (19.2%), and ongoing support (3.9%).
- The top 3 worst website design mistakes include non-responsive site designs (64.29%), absent or terrible calls to action (48.21%), and the use of poor images (42.56%).
How to Improve Website Performance
We’ve prepared some tips based on the data above so you can get the most out of your website.
Make Your Site Load Faster
Website builders and e-commerce platforms, like Wix or Shopify, often include hosting. This is convenient for beginners without extensive technical knowledge.
However, for complete control over your site speed, consider hosting it on a robust web hosting service with a professional content management system (CMS) like WordPress. While more complex to set up, its tweakable settings allow for significantly faster loading times than most website builders.
You can further boost your site’s loading speed and user-friendliness by implementing a caching tool. This tool saves your site files in visitors’ browsers, allowing for faster local loading on subsequent visits rather than fetching files from servers. Caching tools also offer features like CSS and JavaScript minification.
Crucially, compress images to reduce file sizes without sacrificing quality. This is vital for image-heavy sites, such as e-commerce platforms and photography portfolios, which rely on extensive visuals.
To ensure your site is optimized for speed, check your domain’s Core Web Vitals score via Google Search Console. Alternatively, run individual pages through Google PageSpeed Insights to identify performance issues that may hinder user experience.
Optimize Your Website for Conversions
While attracting traffic is valuable for business awareness, prompting visitors to click, purchase, or complete a form is even better.
Effective conversion optimization isn’t just about adding buttons or forms; it involves strategic use of colors, copy, and size for buttons, and minimizing required fields in forms to maximize submissions.
Ensure button colors contrast with your website’s theme to make them pop. Use action-oriented language in your button copy to encourage clicks.
Limit form fields to three if possible (e.g., name, email, and one relevant business query). Fewer fields make the form-filling process smoother for visitors, leading to more submissions.
Placement is another key conversion factor. Ideally, your calls to action should appear above the fold, ensuring most visitors see and interact with them immediately.
Promote Your Site
Once your website is conversion-optimized, the next step is to drive more visitors. As the statistics show, SEO is one of the most effective channels for acquiring traffic.
Identify relevant keywords to create and optimize web pages. Write valuable blog posts that fulfill search intent to rank for your target keywords. Showcase your knowledge and expertise in your niche. AI content generators can assist in content planning and creation for SEO, but always fact-check and edit AI-generated content. Building backlinks from authoritative websites is also essential to boost your rankings in Google search results. Many SEO tools have specific features for link-building to make the process quicker.
However, relying solely on search engines for traffic can be risky. A Google algorithm update could negatively impact your site if your SEO strategy is careless (e.g., questionable backlinks or unhelpful content).
Diversifying your traffic sources is crucial for maintaining consistent website traffic. Build an email list and send relevant content to your subscribers. Share your new posts and updates on your social media channels.
Each channel has specific strategies for reaching your target audience. For social media, blend promotional posts with engaging content like questions, surveys, and tips. For email campaigns, use email marketing software to set up opt-in forms on your site for more sign-ups. You can find email marketing tips and best practices to guide your strategy.
Develop a structured process using these tactics to attract your audience and build a following across various channels without depending on a single traffic source.
Spy on Your Competitors
Knowing best practices for promoting your site is one thing; understanding what specifically yields results in your industry is another. Optimize your website for success by analyzing what your top competitors do to generate traffic, leads, and sales.
Using competitive analysis tools, you can discover:
- What keywords they rank for in organic search results.
- The estimated traffic for each keyword.
- Backlinks they have that you don’t.
- Queries they are bidding for in paid search.
- Their ad copies.
This data can directly inform your strategy. You can learn more in SEO competitive analysis guides. A traffic checker like Similarweb also provides valuable insights into your competitors’ strategies.
An app like Sprout Social can analyze your competitors’ social media posts to identify which generated the most impressions and conversions.
The specific tactics you adopt from competitors will depend on your business goals. However, by understanding market gaps, you can position your website to capitalize on overlooked opportunities and gain a competitive edge.
Monitor Its Traffic
After launching your website and campaigns, regularly check traffic using website analytics platforms and software like Google Analytics for comprehensive traffic analysis. These tools provide valuable insights into your traffic sources.
These tools will reveal the sources driving visitors to your site and whether they align with your goals. Analyze how many visitors convert into leads or customers and identify areas for improving your conversion rate. To capture leads effectively, ensure you have well-designed forms and landing pages to collect contact information from visitors who aren’t yet ready to make a purchase.
If your site attracts significant traffic from a specific location, consider doubling down on efforts in that region to maximize engagement. For tactics that aren’t drawing visitors, rework or discontinue them and reallocate resources to more effective strategies.
Understanding user behavior is paramount for increasing conversions. You need to know how users navigate your web pages and interact with elements. A heatmapping platform like Hotjar can reveal which parts of a page visitors abandon most frequently and which elements they click on the most.
Once you have these reports, strategize ways to encourage readers to scroll further down the page and reposition your Calls to Action (CTAs) to areas where visitors interact most.
If you’re looking to outsource website building and content marketing, you can discover and hire top talent on freelance marketplaces.
Did you know ChatGPT reached 1 million users in 5 days? Find more interesting AI statistics.